In this post, we will talk about portfolios, how to compare your portfolio to a given benchmark, and how to analyze the risk within it, all using a great library in Python called quantstats.
First and foremost, let us define “portfolio”. In the financial world, a portfolio is a subset of assets you choose. They can be stocks, commodities, bonds, cash, etc. By building a diverse portfolio, investors and institutions can manage risk, increase returns, etc.
As we have an infinity of financial products to choose from and we want to apply a strategy to that chosen collection — minimizing risks or maximizing returns, for example, building a portfolio is not a trivial task. In fact, a professional who manages funds is highly valued for this reason.
Notice that a portfolio should be reviewed over time to better adjust to market movements and economic moments. By reevaluating the portfolio, the “weights” we place on each financial asset may change. And the name weight represents the percentage you allocate to each asset.
Besides finding the proper collection of financial products for your portfolio, finding the weights of these products is another key factor here. This weight may be determined by the confidence you have in the financial product, future growth you expect from it, historic performance, company sector, risk, and many others.
Example portfolio
Let’s say you love tech companies and want to create a portfolio based on FAANG, so initially, we will use 20% of weight for each stock
- Facebook, Inc. – META
- Amazon.com Inc. – AMZN
- Apple Inc. – AAPL
- Netflix, Inc. – NFLX
- Alphabet Inc. (Google) – GOOGL
Here is a starting code for reading the stocks info and creating a portfolio with it: (Note: remember to download the libraries with pip install library)
import yfinance as yf
import pandas as pd
import numpy as np
import quantstats as qs

# Download stock info
tickers = ['META', 'AMZN', 'AAPL', 'NFLX', 'GOOGL']
data = yf.download(tickers, start='2022-01-01', end='2023-01-01')['Adj Close']

# print data
data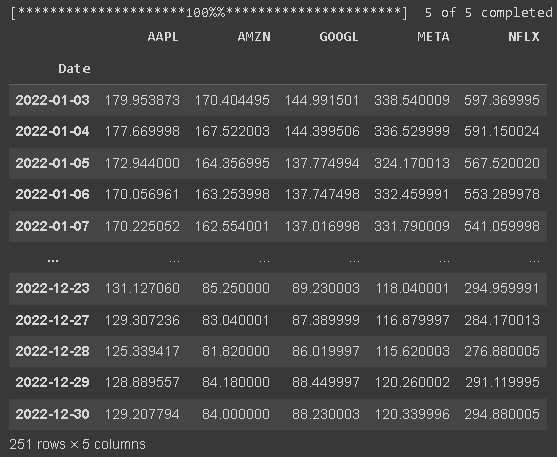
returns = data.pct_change().dropna()
returns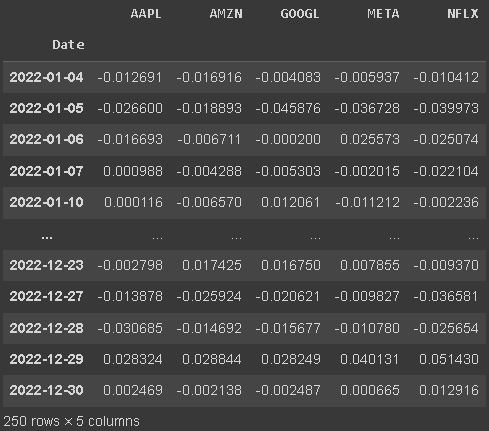
# weights - 'META', 'AMZN', 'AAPL', 'NFLX', 'GOOGL'
w = [0.2, 0.2, 0.2, 0.2, 0.2]

def calculate_portfolio(returns, tickers, w):
  portfolio = None
  for i, t in enumerate(tickers):
    if i == 0:
      portfolio = returns[t]*w[i]
    else:
      portfolio += returns[t]*w[i]
  return portfolio


portfolio = calculate_portfolio(returns, tickers, w)

# daily returns of portfolio
portfolio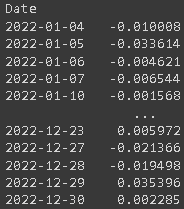
With quantstats, it’s easy to compare the benchmark against your strategy/portfolio:
# download data from sp500
sp500 = qs.utils.download_returns('^GSPC')
sp500 = sp500.loc['2022-01-01':'2023-01-01']
sp500
# report on portfolio performance from 2022-01-01 to 2023-01-01 considering sp500 benchmark
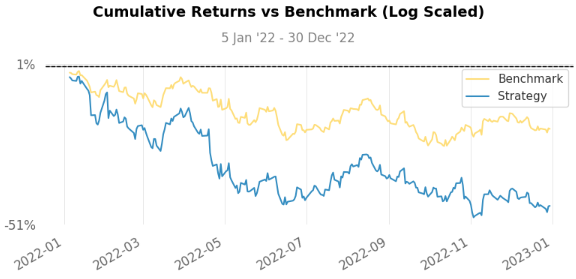
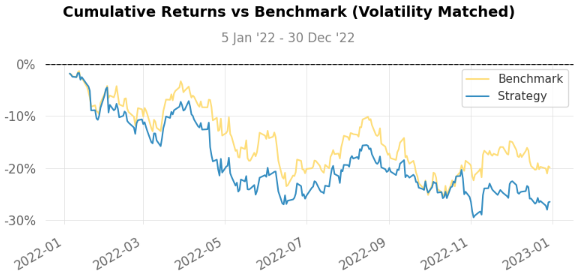
qs.reports.full(portfolio, benchmark = sp500)After running it, you’ll see tons of charts and useful info
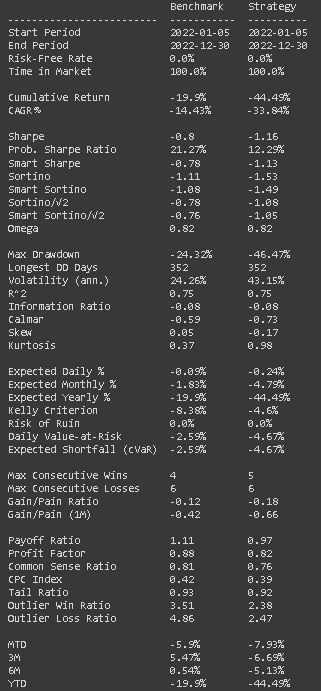
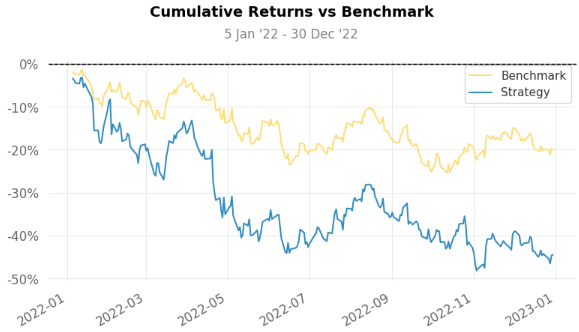
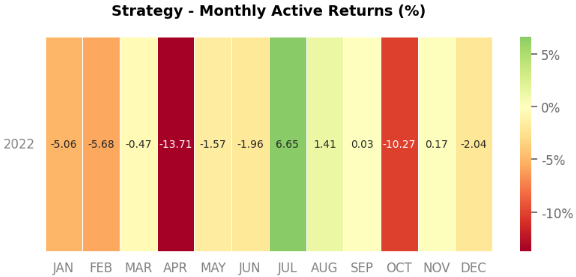
With a greater drawdown (-46.4% for strategy vs -24.32% for S&P500) and a greater annualized volatility of 43.1% vs 24.2%, it is easy to notice this strategy was really risky for the date period we chose. Added to that, we have a negative cumulative return (-44.49%) even compared to the S&P500, which was also negative (-19.9%).
This can be explained by the fact that the beta for the strategy is 1.54 — more volatile than SP&500 — and also considering these are tech companies, they tend to vary in the same way — If the sector is going up, they will likely go up together as the correlation of 86.48% suggests — This corroborates with the overall idea the strategy is risky.
It’s important to mention we chose a small window of time for analyzing the results — 1 year of historical data is not that much if we consider some strategies are planned for decades/retirement etc. In fact, if we change the time interval to be from 01-01-2013 to 01-01-2023, check some of these new charts:
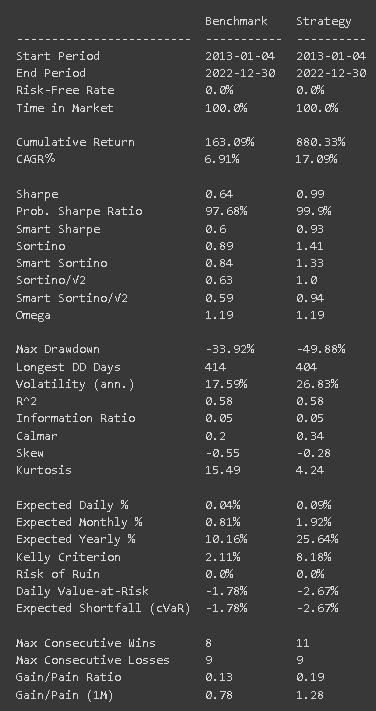
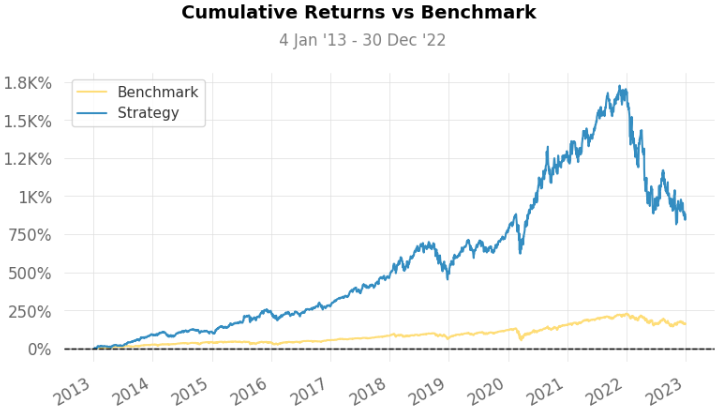
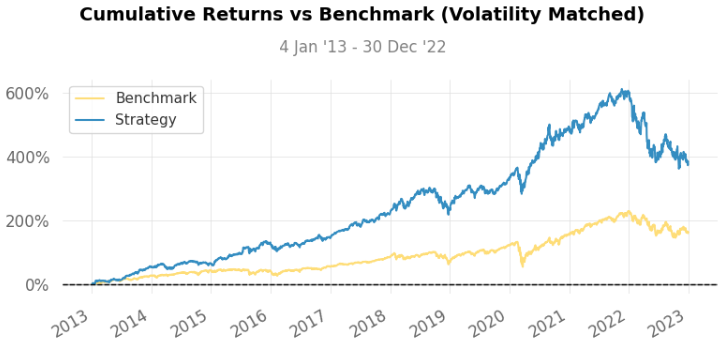
Checking the 10 years, we see our FAANG strategy has 5 times more cumulative returns than the S&P500, a surprising 880.33% return against 163.09%. Even though, this strategy has more annualized volatility and the risk considerations we did still hold, so there is always some trade-off in this sense.
Thinking about that, we can use some modern strategies to weigh our portfolio in a way that reduces risk while increasing return, but this is content for another post!
Hope you liked it so far and I see you in the next post!