Daily returns
When trading stocks there is the concept of buying and selling the stock on the same day — this is known as day trading. Even if you don’t trade daily, it might be useful to know the daily return of that particular stock for comparison or benchmark purposes.
For calculating this daily return we need to calculate the difference between the stock’s closing price on one day and its closing price the day before, divided by the closing on the day before, and multiplied by 100 to find the percentage.
As an example, if a stock closes by 50 dollars on Thursday and later closes by 55 dollars on Friday, the daily return would be: ((55 – 50) / 50) X 100 = 10%
In this fictitious example, we verified that the stock price varied by 10% over Thursday — Notice we could find a negative return if the closing price on Friday is less than the closing price on Thursday.
Using Python libraries to unlock daily return computation
We have some libraries in Python that can help us calculate daily returns with a few lines of code.
One we can mention is Quantstats, in which you can download financial data and use it to plot charts and infer information on returns over time and volatility and returns over time.
To install it you can do
pip install quantstatsOnce it’s installed, you can import it and use the utils.download_returns method that receives a stock ticket as a parameter.
In this example, we will look for daily returns on NVIDIA and MICROSOFT stocks starting 2010-07-01 up to 2023-10-25. Feel free to use your favorite tickers and timestamps though:
import quantstats as qs
nvidia = qs.utils.download_returns('NVDA')
nvidia = nvidia.loc['2010-07-01':'2023-10-25']
msft = qs.utils.download_returns('MSFT')
msft = msft.loc['2010-07-01':'2023-10-25']
You can print your nvidia and msft variables to check what is in there and you’ll notice we have an array indexed by Date and containing the daily returns for each Date

To make it easier we can output a chart of daily returns over time with the following code:
qs.plots.daily_returns(nvidia, benchmark=0)
qs.plots.daily_returns(msft, benchmark=0)
Here are the results
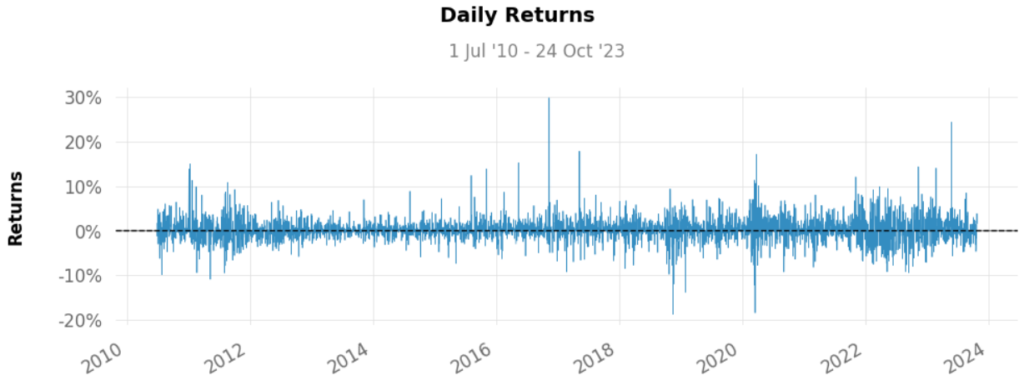
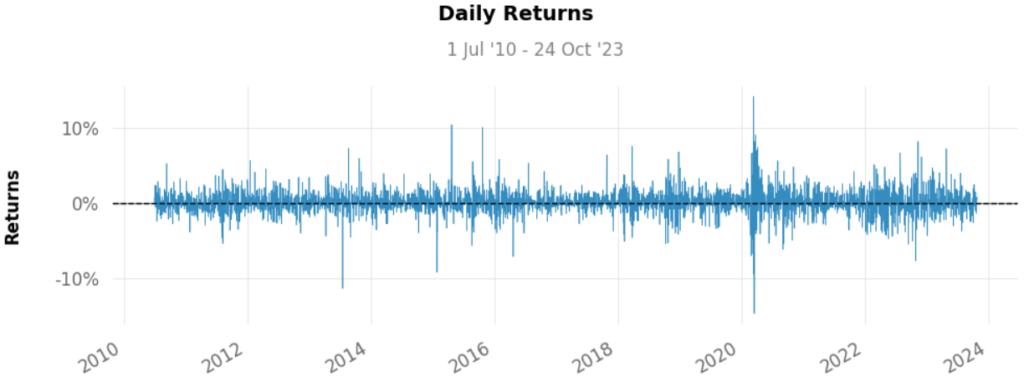
By these graphs alone we can infer a lot of things, but just some interesting observations: there are high return variations at NVIDIA, of up to 30% or down to -20% per day.
That said, if your investment strategy seeks to minimize the risk associated with volatility, for example, that would not be a good choice for you. These returns show this stock could suffer due to market announcements, earnings reports, etc — these were likely the reasons for these discrepant returns.
In any case, we need a more detailed analysis of these results to make sure and we can start by checking how they accumulate over time — this is the topic I intend to cover in the next posts.
Thank you for reading this far, I hope you found the content interesting. and don’t forget to leave a comment and suggest what you would like to see next!