Bitcoin has soared to an all-time high, surpassing previous records and capturing the attention of investors worldwide. Several factors contribute to this historic milestone:
- Institutional Adoption: Increasing interest from institutional investors, including renowned financial institutions and corporations, has provided legitimacy to Bitcoin as a viable asset class. Institutions such as MicroStrategy, Square, and Tesla have allocated significant portions of their reserves to Bitcoin, signaling confidence in its long-term value.
- Growing Retail Demand: Retail investors continue to flock to Bitcoin, drawn by its potential for high returns and as a hedge against inflation. User-friendly platforms and the proliferation of mobile apps have made it easier than ever for individuals to buy and hold Bitcoin.
- Limited Supply: Bitcoin’s scarcity is a fundamental feature that contributes to its value proposition. With a fixed supply capped at 21 million coins, the diminishing rate of new Bitcoin issuance through the process of halving reinforces its scarcity over time.
Speaking of halving, this event occurs approximately every four years and entails a 50% reduction in the rate at which new Bitcoins are created. The most recent halving took place in April 2024, reducing the block reward from 6.25 to 3.125 bitcoins. Historically, halving events have been associated with significant price increases as the reduced supply dynamics amplify Bitcoin’s scarcity.
But is this true? That’s what we will cover in today’s post.
Halving dates
First, to analyze the Halving impact on Bitcoin price, we need to define the past halving dates, and these are:
- 07/09/2016
- 05/11/2020
- 04/19/2024
There is also a halving happening in 2012, but this data is not well covered by crawling tools AND Bitcoin was just starting so we will not consider that day in our analysis.
What do we want to analyze?
Let’s define a good approach to what to analyze about bitcoin price.
It would be interesting to see how the price on the day of the Bitcoin halving compares to the price before and after it. For that, let’s define an arbitrary number of days — let’s say 5 — before and after Bitcoin’s Halving dates and verify.
Also, since five days before the halving date it might be the case that Bitcoin is priced for that already, let’s also look at 30 and 60 days before the halving
Let’s do some code for that!
Code
To get Bitcoin data, we will import the yfinance library in Python. There are a bunch of libraries out there for doing so, but this one is easy to use and doesn’t ask for register and API_KEYS.
Obtaining Bitcoin price is as simple as
BTC_Ticker = yf.Ticker("BTC-USD")
BTC_Data = BTC_Ticker.history(period="max")
As for obtaining the rest of the values, we can iterate over halving dates and get the relevant dates we defined before — 5, 30, 60 days before, and 5 days after the date. The code looks like this:
import yfinance as yf
# get historic
def get_bitcoin_data():
BTC_Ticker = yf.Ticker("BTC-USD")
BTC_Data = BTC_Ticker.history(period="max")
return BTC_Data
bitcoin_data = get_bitcoin_data()
# define halving days
halving_dates = ["2016-07-09", "2020-05-11", "2024-04-19"]
num_of_days = 5
for date in halving_dates:
bitcoin_data = get_bitcoin_data()
two_mo_before = bitcoin_data.loc[:date].iloc[-60] #30 days before
one_mo_before = bitcoin_data.loc[:date].iloc[-30] #30 days before
before_halving = bitcoin_data.loc[:date].iloc[-num_of_days]
after_halving = bitcoin_data.loc[date:].iloc[num_of_days]
one_mo_before_close = one_mo_before['Close']
two_mo_before_close = two_mo_before['Close']
before_halving_close = before_halving['Close']
after_halving_close = after_halving['Close']
halving_day_value = bitcoin_data.loc[date, "Close"]
print("Halving day:", date)
print(f"Two month before halving: {two_mo_before_close}")
print(f"One month before halving: {one_mo_before_close}")
print(f"{num_of_days} days before halving: {before_halving_close}")
print("Closing value on halving day:", halving_day_value)
print(f"{num_of_days} days after halving: {after_halving_close}")
print(f"Price change from {num_of_days} days before to halving day: {((halving_day_value - before_halving_close) / before_halving_close) * 100}%")
print(f"Price change from halving day to {num_of_days} days after halving day: {((after_halving_close - halving_day_value) / halving_day_value) * 100}%")
print(f"Price change from {num_of_days} days before to {num_of_days} days after halving: {((after_halving_close - before_halving_close) / before_halving_close) * 100}%")
print(f"Price change from one month before to halving day: {((halving_day_value - one_mo_before_close) / one_mo_before_close) * 100}%")
print(f"Price change from one month before to {num_of_days} days after halving: {((after_halving_close - one_mo_before_close) / one_mo_before_close) * 100}%")
print(f"Price change from two months before to {num_of_days} days after halving: {((after_halving_close - two_mo_before_close) / two_mo_before_close) * 100}%")
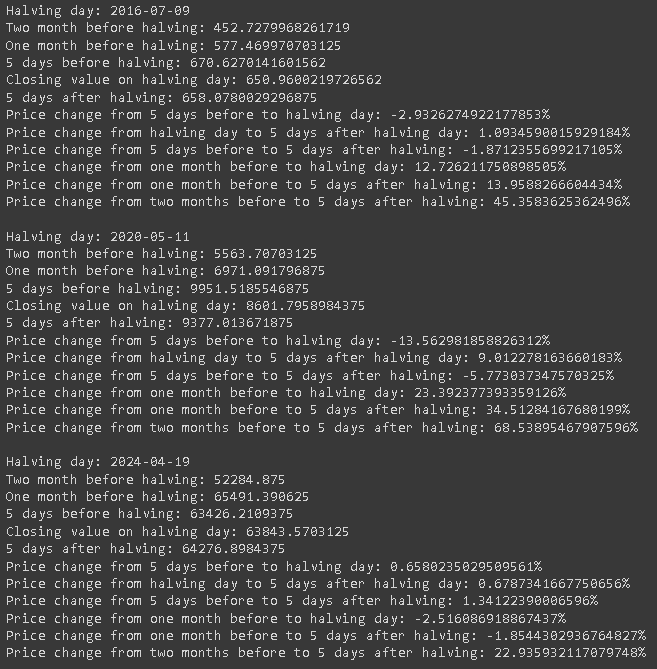
print()We did a bunch of prints to check the values and conclude about the data. I’ll run it locally and paste here the results
Analyzing results
So, let’s analyze each data individually.
2016
Bitcoin was almost unrecognized at that time and the value was much lower. We can notice that from 5 days before the halving until the day of the halving, bitcoin fell about 3%, but when checking the variation between one month and two months before the halving and days after the halving date, we see a significant increase in this value, reaching up to 45% more in 2 months.
2020
People know more about Bitcoin and its value is rising. From 5 days before the halving until the day of the halving, bitcoin fell a lot! More than 13%. However, if you bought on the halving day, you would be good with your 9% profit in 5 days after. At the same time, if you anticipated your buy in 5 days you would end up losing 5% (from 5 days before to 5 days after).
The fact is that the Bitcoin halving was already priced some days before halving. We can notice that by verifying the delta from one month before to halving day: 23%. Also, by anticipating your buying in 60 days of halving day, you would end up with a 68% profit!
2024
People know and talk about Bitcoin and know the power it has as a disruptive technology. There is a lot of news about the currency and everyone is aware of it and planning for the halving day.
We can see that the variation from 5 days before to halving day is about 0.65%. However, when we check the delta from one month before halving to halving day we can see it’s negative 2% approximately. Why is that?
Well, people know about halving and they’ve been anticipating their buying, so the halving impact is “priced in” 1 month before already, as we can see by the delta. To corroborate with that, we can see that 2 months before to halving date we ended up with 22.9% profit, so the move was anticipated but not that long!
To consider
Obviously, one asset price is never dictated by a singular fact. We have wars, news, country economies, and many other factors that directly impact the price of Bitcoin itself. However, it is possible to notice this trend of currency growth from some time before the halving and after it.
Also, this was a simplified analysis we did for the Bitcoin price. Of course, you can have a more accurate forecast by analyzing more days and more factors that I’ll not cover in this post.
Anyway, that was it. Hope you liked it. What do you think about Bitcoin price moving forward?
See you in the next post!