This is a series I’ll be doing to unravel some of the most common indicators we use for verifying the price momentum and opportunities to take action buying or selling a specific asset.
One such key tool is the Relative Strength Index (RSI), a powerful metric that offers insights into the strength and direction of a financial instrument’s price movements.
Understanding RSI
The RSI, developed by J. Welles Wilder, is a momentum oscillator that measures the speed and change of price movements. Ranging from 0 to 100, RSI identifies overbought or oversold conditions in a market, providing a framework to gauge potential trend reversals. Traders and investors widely utilize RSI to assess the strength of an asset’s recent performance and anticipate potential turning points in the market.
The RSI is usually calculated using the following formula:
RSI = 100− 100/(1+RS)
where RS (Relative Strength) is the average gain divided by the average loss over a specified period, commonly 14 days, the formula involves several steps:
- Calculate daily price changes by subtracting the previous day’s close from the current day’s close.
- Separate the gains (positive price changes) from the losses (negative price changes).
- Calculate the average gain and average loss over the chosen period.
- Find the relative strength (RS) by dividing the average gain by the average loss.
- Finally, plug the RS value into the RSI formula to get the Relative Strength Index.
This is the overall idea, but there are some variations to this. The first obvious variable is the number of intervals/days we consider. In the default indicator we use 14, but you can define any number you want.
Other variations include:
- Stochastic RSI:
- Description: Combines the concepts of RSI and the Stochastic Oscillator.
- Usage: Utilizes RSI to calculate the position within the 0 to 100 range, and then applies the stochastic formula to smooth the results.
- Purpose: Helps identify potential trend reversals by considering both the strength and the speed of price movements.
- Smoothed RSI:
- Description: Applies smoothing techniques, often using Exponential Moving Averages (EMA).
- Usage: Reduces the impact of rapid price fluctuations, providing a more stable representation of market conditions.
- Purpose: Offers a less reactive RSI, filtering out noise and highlighting more significant price trends.
- Wilders RSI:
- Description: A modified version that uses an exponential moving average to calculate gains and losses.
- Usage: Provides a faster response to changes in prices compared to the traditional RSI.
- Purpose: Offers a more responsive RSI, suitable for traders looking for quicker signals of potential trend reversals.
And the list goes on…
Application
Spotting Overbought and Oversold Conditions:
One of the primary applications of RSI is to identify overbought and oversold conditions. When RSI surpasses the 70 mark, it suggests that the asset may be overbought, indicating a potential reversal or correction. Conversely, an RSI below 30 signals potential oversold conditions, suggesting the asset might be due for a rebound. This insight empowers investors to make informed decisions about entry and exit points, contributing to a more strategic approach to trading.
Divergence and Trend Confirmation:
RSI’s versatility extends beyond identifying extreme conditions. Traders also rely on RSI divergence to confirm trends. Divergence occurs when the RSI doesn’t align with the price movement, signaling a potential trend reversal. By combining RSI with other technical indicators, investors can strengthen their analyses and gain a more comprehensive understanding of market dynamics.
Risk Management with RSI:
Effective risk management is a cornerstone of successful investing. RSI serves as a valuable tool in this regard by helping investors set realistic profit targets and stop-loss levels. By understanding the potential for overbought or oversold conditions, traders can establish risk parameters that align with the current market sentiment, enhancing the precision of their risk management strategies.
Build an RSI graph in Python
One good thing is that Python offers tools for calculating RSI, so we don’t need to calculate it by hand. We’re going to use the ta library in our code, so install it using the pip
!pip install taAfter that, let’s do the same process as always… read data from a company using yfinance library. In this example, I will read NVIDIA information:
# imports
import yfinance as yf
import pandas as pd
import matplotlib.pyplot as plt
import plotly.graph_objects as go

from ta.momentum import RSIIndicator
from plotly.subplots import make_subplots

# dates
start_date = "2013-06-30"
end_date = "2023-06-30"

symbol = "NVDA"

company = yf.download(symbol, start=start_date, end=end_date)
Calculating RSI easily with the ta library
# calculating rsi
rsi_period = 14 # you can change this period if needed
company['RSI'] = RSIIndicator(company['Adj Close'], window=rsi_period).rsi()
Finally, let’s use the plotly to plot our graphs
fig = make_subplots(rows=2, cols=1, shared_xaxes=True, vertical_spacing=0.1, subplot_titles=['Candlestick Chart', 'RSI Analysis'])

# company price
fig.add_trace(go.Candlestick(x=company.index,
                open=company['Open'],
                high=company['High'],
                low=company['Low'],
                close=company['Close'], name='Candlesticks'), row=1, col=1)

# add info to RSI
fig.add_trace(go.Scatter(x=company.index, y=company['RSI'],
                         mode='lines', name='RSI', line=dict(color='orange')), row=2, col=1)

fig.update_layout(
    title=f'Candlestick Chart and RSI Analysis for {symbol}',
    xaxis_title='Date',
    template='plotly_dark',
)

# rsi varies from 0 to 100, but just to give us more space I set range -50 to 150
fig.update_yaxes(range=[-50, 150], row=2, col=1)

fig.update_layout(
    updatemenus=[
        dict(
            type='buttons',
            showactive=False,
            buttons=[
                dict(label='Linear Scale',
                     method='relayout',
                     args=['yaxis2.type', 'linear']),
                dict(label='Log Scale',
                     method='relayout',
                     args=['yaxis2.type', 'log'])
            ]
        )
    ]
)

fig.show()
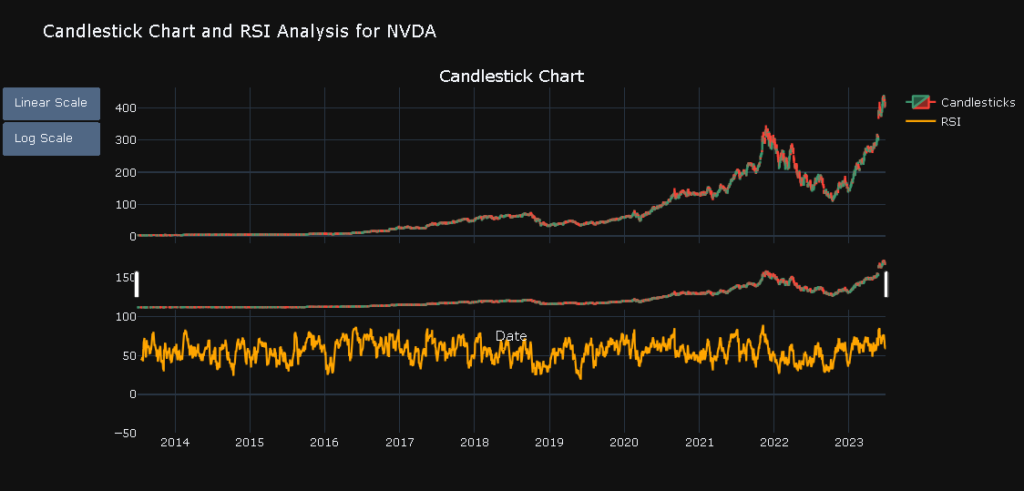
And that’s it! Let’s check what it looks like:

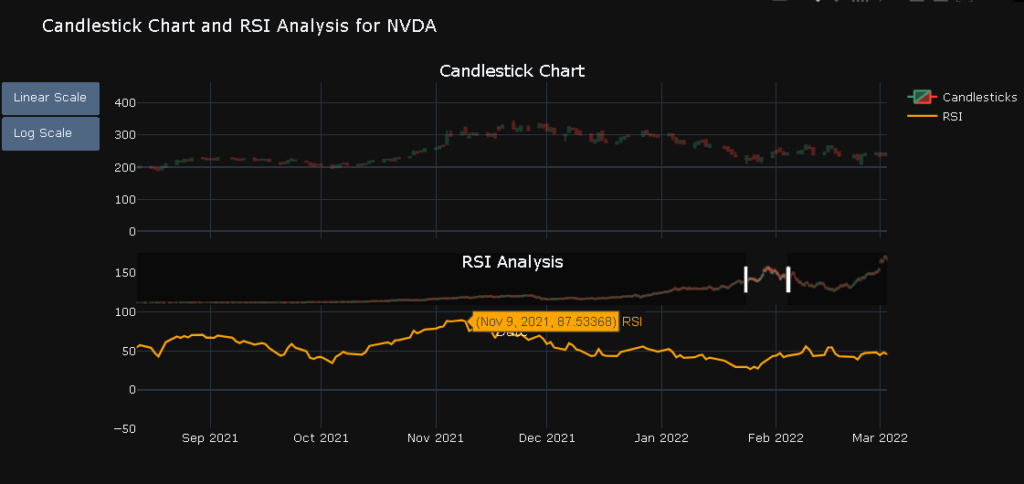
Plotly let us interact with the graph, so you can zoom in on a specific time

On this specific date, November 9th, 2021, we can check the RSI for NVIDIA was high! Nearly 90!
As stated before, above 70 RSI means overbought for the indicator, so we can see it starts to drop some days after it!
Of course, we have to take into account other indicators and facts to enter a sell operation at this point but note that the RSI was an interesting indicator of reversing the trend.
That was it for this post! Hope you learned a bit more about RSI
Feel free to comment on what we should cover next about indicators and financial content.
Thank you!
